Algorithmic Venue Tracking Transforms In-Play Adjustments Across Seasonal Athletic Calendars
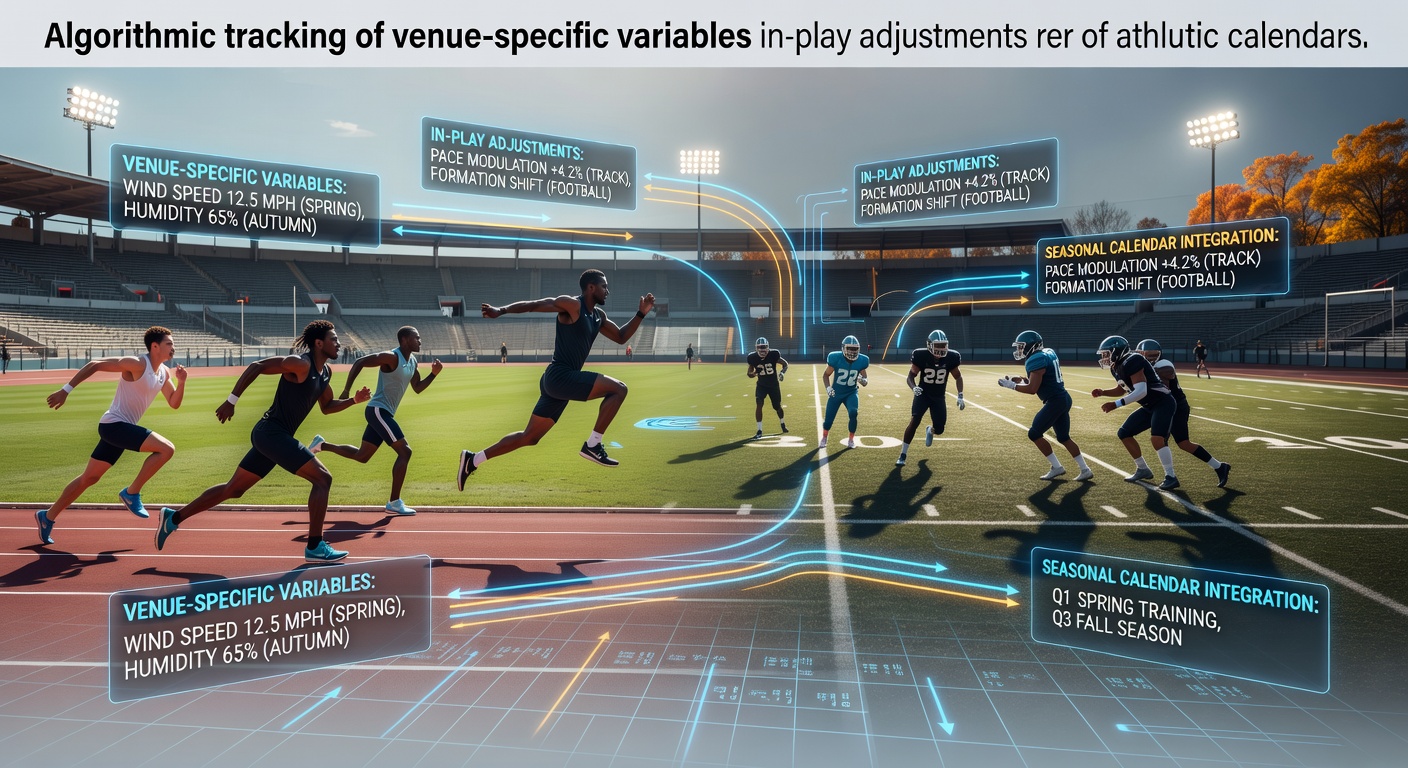
Venue-specific variables have gained prominence in sports analytics because algorithms now process real-time inputs from stadiums, fields, and arenas to modify in-play betting lines throughout entire seasons. These systems pull data on elevation, humidity, surface friction, wind patterns, and even crowd density, then recalibrate odds within seconds of detecting shifts. Professional leagues across North America and Europe have integrated similar feeds into their official data streams, which allows betting operators to respond faster than manual models ever could.
Core Variables Tracked by Modern Algorithms
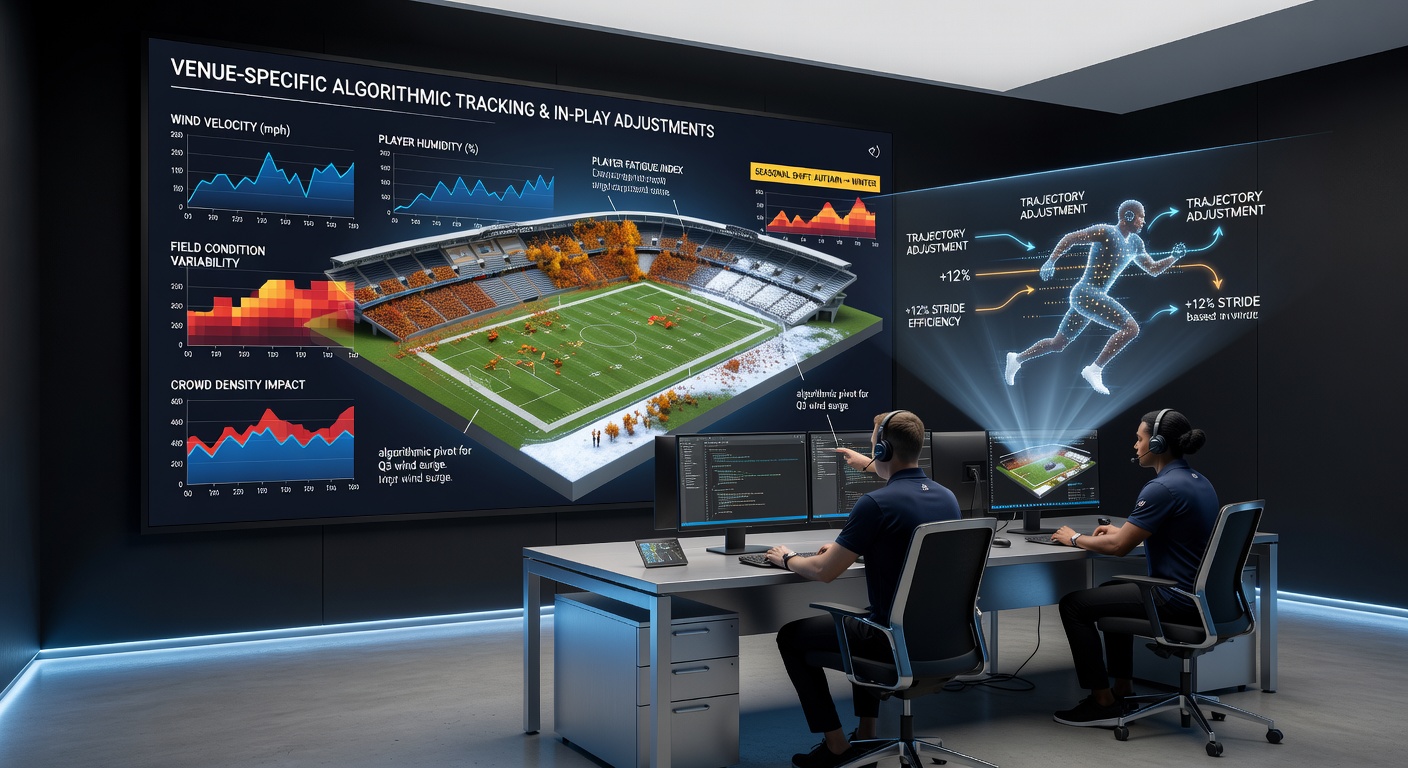
Algorithms monitor several venue elements that change from game to game and month to month. Elevation affects ball flight in baseball and soccer, while field moisture levels alter traction for football and rugby players. Temperature swings influence player endurance and equipment performance, particularly during early-season games versus late-season contests. Operators feed these readings into neural networks that compare current conditions against historical datasets from the same location across multiple years.
Data streams arrive from embedded sensors, satellite feeds, and venue maintenance reports. One system deployed by major European soccer leagues updates pitch hardness readings every fifteen minutes during matches. Another platform used in North American basketball arenas tracks air pressure and humidity because these factors change how the ball bounces off rims and backboards. Adjustments occur continuously, which means in-play lines can move even when the score remains static.
Seasonal Calendar Impacts on Model Accuracy
Seasonal transitions introduce new layers of complexity. Spring baseball games often feature cooler night temperatures and softer infield dirt compared with midsummer contests played under intense heat. Algorithms trained on full-season averages must isolate month-specific patterns to avoid overcorrecting or undercorrecting live odds. Football models similarly separate early-season outdoor games from late-season contests where frozen or muddy fields become common at certain stadiums.
May 2026 marked a notable period for testing these seasonal adjustments. Multiple major league schedules overlapped with variable weather across different regions, giving operators fresh datasets to refine their models. Algorithms incorporated precipitation forecasts and temperature gradients from dozens of venues simultaneously, which produced tighter spreads during live play than had appeared in prior seasons.
Regional Regulatory Perspectives on Data Integration
Regulatory bodies have begun examining how venue data flows into betting platforms. The Alcohol and Gaming Commission of Ontario requires operators to document which external sensors feed their algorithms and how often models retrain on new venue conditions. Australian state regulators have asked similar questions about transparency when algorithms adjust lines based on location-specific inputs during live events. These requirements aim to ensure that bettors receive consistent information regardless of which venue hosts a particular contest.
Industry groups such as the American Gaming Association have published guidelines encouraging operators to disclose major venue variables that trigger line movements. The guidelines do not mandate specific algorithms yet they recommend periodic audits of model performance across different seasonal periods. Several operators now publish summary reports that show average line-shift magnitudes tied to venue factors during spring, summer, fall, and winter schedules.
Examples Across Different Sports
Take professional hockey, where arena ice temperature and humidity readings directly influence puck speed and goalie reaction times. Algorithms adjust power-play probabilities within the first period when sensors detect softer ice than expected. In tennis, algorithms track court surface wear throughout multi-day tournaments because baseline friction changes affect serve speeds and rally lengths. Observers note that these adjustments appear most frequently during outdoor events where weather conditions evolve rapidly between morning and evening sessions.
Baseball provides another clear illustration. Algorithms compare current wind direction and speed against historical data from the same ballpark during the same month. When gusts exceed thresholds established by prior seasons, models immediately recalculate home-run probabilities and adjust corresponding in-play propositions. The same systems account for daylight length changes that occur as summer progresses, which affects visibility for outfielders during twilight games.
Future Developments in Venue Data Processing
Research institutions continue to explore additional variables that could enter future models. University-led projects have tested wearable sensor data from players to correlate fatigue levels with specific venue conditions across long road trips. Early findings suggest that combining player biometrics with venue metrics may further refine in-play adjustments, particularly during compressed portions of seasonal schedules.
Operators are also examining how venue renovations affect long-term model accuracy. When a stadium installs new lighting or alters its seating configuration, historical datasets require recalibration. Teams that maintain updated venue profiles report fewer large line corrections after such changes compared with operators relying on older baselines.
Conclusion
Algorithmic tracking of venue-specific variables has become a standard component of in-play betting systems across seasonal athletic calendars. Real-time sensor data, seasonal pattern recognition, and regulatory oversight together shape how quickly and precisely lines move during live events. As additional data sources integrate into these platforms, adjustments will likely reflect an even broader range of location-based factors throughout each sport's annual cycle.